I drink cups of tea, sometimes several cups a day.
ChatGPT drinks several liters of water a day.
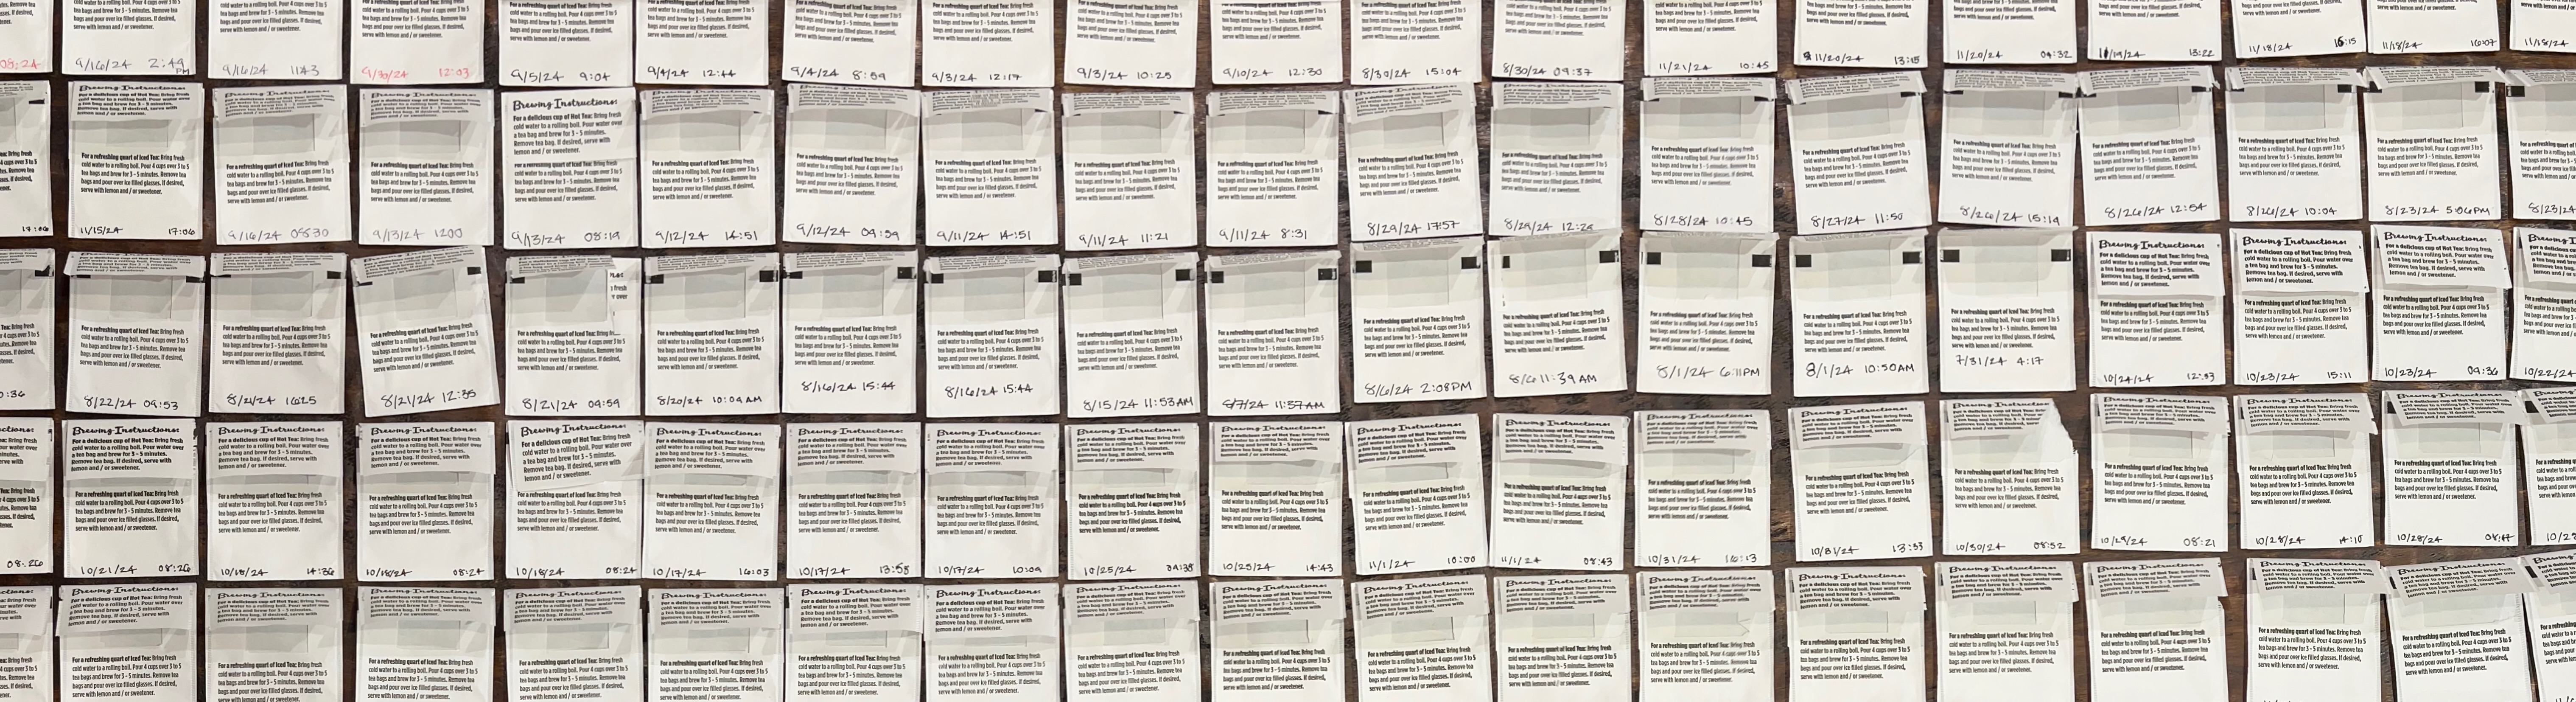
A while after I started drinking tea, I noticed how many tea bags I was
throwing away. Surely, this was a missed opportuinity for a project. I'm
sure you're having the same thought: "obviously, you can record each time
you drink tea by writing a timestamp on the bag". And just like that, a new
project to distract me from an earlier project which was a distraction from
an even earlier project which was a distraction from an even earlier than
the previously mentioned project was born.
Prompt Wrestling:
My first thought was to use ChatGPT or Google's AI to transcribe the data
for me, but I should have transcribed everything myself.
The best approach was my girlfriend's idea: take several pictures, each
containing a few tea bags.
Afterwards, I manually corrected lots of transcription errors the
artificial intelligence had made.
Data Visualization:
I plotted the data using Matplotlib. The plot is rendered in the browser
using Matplotlib via
PyScript.
The angle from the origin (12:00) of each point corresponds to the time of
day I wrote on the tea bag. The radius/distance from the origin corresponds
to the date I wrote on the tea bag.
If you'd like to see the Python code looks,
see it here.
See the plot here:
Conclusion:
In conclusion, it appears as if I drink tea at different times throughout
the work day, but almost never between 7-8AM, and 6-7PM, even though I
sometimes work during these hours.